
More and more companies are experiencing the great relevance of usability and user experience (UX). For example, because their customers are migrating to competitors with better products, more elegant websites or more intuitive apps, or the conversion rate (CR) is plummeting.
The result: an increasing number of companies are investing in user research, usability testing and UX design. However, in over 900 customer projects with large and small companies, we have found that only very few companies consistently record UX KPIs.
In the following, I will show you why it is so important to measure UX KPIs, what to look out for and how to select the right KPIs.
Contents
- UX chaos and ineffectiveness – what happens if I don’t track UX KPIs?
- Back to basics: What are KPIs?
- Criteria for good KPIs – What do I need to look out for when measuring?
- KPIs at all levels – what is the difference between process, impact and outcome KPIs?
- Conclusion: KPIs are the only way to make evidence-based decisions.
UX chaos and ineffectiveness – what happens if I don’t track UX KPIs?
Of course, UX research, UX testing and UX design also work without KPIs. However, not being able to fall back on UX KPIs means that decisions are made based on gut instinct, processes are improved on instinct and budgets and approvals have to be fought for by management without a solid basis for argumentation.
Without KPIs, the efficiency and effectiveness of UX research, UX testing and UX design activities is unclear. UX researchers don’t know what to test next, product managers don’t know which usability problems need to be solved first, and nobody knows what the last usability problems have achieved.
This is what working in UX and product teams without KPIs often looks like (click to enlarge):

(Illustration: Christin Herrmann)
If you answer any of the following questions with “I have no idea” or “that’s up to management” or “I’ll just make a gut decision” and don’t track any UX KPIs, then it’s high time you started!
- “How do you know which page / product aspect to test next?”
- “Which usability problems should be solved next?”
- “What feature ideas should be implemented next?”
- “Which tickets from the backlog will be included in the next sprint?”
- “Why have none of the usability problems I have identified been solved so far?”
- “What good did it actually do that we recently solved this one usability problem?”
- “How do I convince my management to provide me with the necessary UX budget?”
If you already measure UX KPIs and still answer the questions in this way, you should definitely rethink your KPI system!
Back to basics: What are KPIs?
Key performance indicators (KPIs) are key figures that reflect the current status quo of a business area. They are suitable as indicators for the success, performance or work load of the respective business area.
KPIs are the only way to record the effectiveness of business activities (as) objectively as possible and thus make informed decisions!
That sounds like a dry definition, and as if you could have looked it up on Wikipedia. However, especially in the UX area, KPIs are often not measured at all or only very poorly because UX-specific subtleties are ignored. And because poorly recorded KPIs make bad decisions look like good decisions, a poor KPI system is often even more fatal to business success than not using KPIs at all.
To help you fully exploit the potential of UX KPIs, this article focuses explicitly on the use of KPIs in the UX area. But first, here are a few universal basics that apply to KPIs in all business areas.
The object of the KPI measurement
KPIs can represent the performance of individuals, the entire UX team or the company as a whole.
KPIs at individual level can be used as a benchmark for bonus payments. For example, a UX researcher could be rewarded for a high number (#) of usability tests carried out within a certain time unit.
KPIs at team or company level often provide better indications for targeted measures than individual KPIs. The joint effectiveness of the UX, product and development teams could be assessed by the number (#) of usability problems solved per unit of time. Efficiency can be measured by the average cost (€) required to solve a usability problem.
In addition to measuring the performance of individuals or groups of people, KPIs are also suitable for recording the performance of products. This applies in particular to digital products. For example, KPIs can relate to user behavior such as frequency or duration or to usability aspects such as ease of use.
The dimension of KPI measurement
KPIs are always quantitative measures, i.e. numbers that can be used to perform mathematical operations. The dimension of these numbers can be, for example, a number (#), a monetary value (€), a duration (t) or a proportion (%). While a number (#) is usually the easiest to measure, the other dimensions often provide a better basis for good decisions and are usually less susceptible to manipulation.
Setting goals and making decisions with KPIs
KPIs as such only show the status quo (e.g. the average conversion rate of a website in a month is 34%). Specific targets (e.g. aiming for a conversion rate of 42%) make it possible to compare the status quo to the set goal. If you fall short of your target, you need to take entrepreneurial measures to get closer to it. In this way, KPIs are also suitable for determining variable bonus payments and thus serve as incentives for individuals and teams.
In short: KPIs show me where I currently stand in relation to my goals and enable me to make informed decisions and derive targeted entrepreneurial activities.
Criteria for good UX KPIs – What do I need to consider when measuring UX?
In order for a UX KPI to fulfill its purpose, favor good decisions and in no way promote bad decisions, it must meet a few criteria.
Good UX KPIs…
- are valid, reliable, objective and economical
- are relevant for the company as a whole
- cannot be manipulated, but can be changed
- are recorded regularly and are subject to fluctuations
- correlate with other company sizes
- are individually adapted to the company
Good KPIs are valid, reliable, objective and economical
You may have heard of the three quality criteria of quantitative research: validity, reliability and objectivity. If you record KPIs that do not meet one or more of these quality criteria or do not meet them adequately, you might as well leave them alone.
In practice, one often encounters the opinion that quality criteria are only something for science and have no place in practice. The arguments: It only costs time, it’s not worth the effort. Such arguments may apply to individual methods of UX research such as guerrilla testing or interviews, but when setting up KPI systems to inform decisions over time, such negligence leads to poor KPIs, which in turn encourage poor decisions and poor business outcomes. In addition to the business suffering, in such situations the UX teams always suffer from the dwindling trust of colleagues, management and the board.
Validity
A KPI is valid if it really measures what it is supposed to measure.
This sounds kind of ridiculous at first and as if it were obvious anyway, but it is not so easy to guarantee, especially with abstract constructs such as satisfaction, or ease of use.
KPIs such as the number of monthly website visitors are validly recorded by systems such as Google Analytics because there is only one way to count them. However, if you want to know how easy it is for users to complete a certain task on your website (e.g. booking a train ticket), there are several ways to measure these KPIs. Users could be asked how easy they found it, e.g. on a scale from very difficult to very easy. However, you could also record the average time users need to book a train or the percentage of users who are unable to complete the task at all.
Using open questions and scales tends to capture the subjective perception of the simplicity of a task, which can vary greatly between users. Measuring time (time on task) or task success rate are more objective measures that can also be used to compare different systems (e.g. in an A/B test or in a competitive comparison test of different train booking systems).
How an (abstract) construct is made measurable (operationalized) therefore depends on the question being asked. Am I concerned with the subjective experience of the user, the recording of an objective measure or something completely different?
However, it is often worthwhile to fall back on measures that are anchored in physics (e.g. time) or that have a clear connection to number systems (e.g. money). These measures are more reliable in what they are supposed to measure (one hundred euros is always one hundred euros). Unless you are interested in the subjective experiences of your own target group, because what is a hundred euros to a Porsche customer?
Reliability
A KPI is reliable if it is measured reliably and accurately in several measurements over time or at different locations.
A centimeter measure always measures ten centimeters the same everywhere, and we want the same for our KPIs. A scale that measures something different on Mondays than on Wednesdays or that is understood differently by Brazilian users than by German users is not suitable as a reliable measure, unless I always measure on Mondays and only in Germany.
Similar to validity, measures that are anchored in physics or have a natural numerical reference and are measured using standardized measurement procedures have a higher reliability than measures for abstract constructs.
Objectivity
A KPI is objective if it does not matter which person (or which system) measures it.
Back to the example of a booking system for train tickets. Let’s say a UX team has decided to measure the ease of the booking task by having a UX researcher observe the users and rate on a scale how easy it was for them. In the past, the UX team has also measured the time it takes users to complete the task and had them fill out a scale themselves. They noticed that the UX researcher’s assessment correlated appropriately with the other measures of simplicity and therefore recognized the assessment as a valid measure. In addition, the UX researcher provided consistent assessments in repeated measurements with the same systems and the same users, which is why reliability was also concluded.
The UX team is happy because the researcher’s assessment is easier than time-consuming measurements. The best thing is that they have recently added a UX researcher to the team who has proven in the same way that he can validly and reliably assess the Ease of Use. But then it happens. Just for fun, the UX team decides that the two of them should simply assess the same ten users and, to the horror of everyone involved, there are huge differences between the assessments of the first UX researcher and the second UX researcher. The first one demands major changes to the booking system, while the second one thinks that everything is fine the way it is. The established procedure is not objective.
The example above illustrates how important it is to check all three quality criteria. The same applies to objectivity: physical measures and natural number systems are often more objective than surveys, observations and expert assessments. However, even with the most accurate centimeter measurement, it can happen that one person slips when measuring and thus arrives at a different result than another. In such a case, it is important that the team sits down together and talks about the inconsistency between different measurements by different researchers and improves the future measurement of the KPIs, for example through better standardization.
Economy
A KPI is economical if its benefits exceed the costs of its measurement.
Economy is not a classic quality criterion that is necessary to guarantee a clean measurement. However, especially in an economic context, the economics of a measurement should definitely be taken into account. KPIs that are expensive or time-consuming to measure or that require a high level of human resources only make sense if the gain in knowledge, the avoidance of serious mistakes and the benefits of evidence-based decisions outweigh these costs.
The recording of uneconomical KPIs can be avoided by selecting KPIs specifically and consciously and evaluating them continuously. It is not worth measuring everything that can be measured. It is better to measure the things that really get you ahead.
Good KPIs are relevant for the company as a whole
In theory, almost anything can be made measurable and assigned a performance target. However, the smaller such measured objects are, the less relevant they are for the company as a whole.
The number of testers that a UX researcher can motivate to participate in an in-depth interview on a Monday evening between 6:00 and 8:00 pm may be very important personally for the UX researcher who overslept and absolutely has to conduct ten more interviews in order to achieve his performance target. However, the company as a whole is much more interested in which findings from in-depth interviews have led to new feature releases and how these feature releases relate to the conversion rate, user growth, market penetration or ad revenue.
Good KPIs cannot be manipulated, but they can be changed
In particular, if bonus payments depend on the achievement of certain KPIs, it must not be possible to manipulate them. If a KPI can be manipulated, this can lead to ineffective or even harmful behavior being incentivized and the KPI ultimately not really measuring what it is supposed to measure.
If, for example, the number of usability problems found is defined as a KPI, this can easily be manipulated by the people evaluating the test, meaning that either important problems can be ignored or unimportant subtleties can flood the development pipeline.
However, the fact that a KPI cannot be manipulated should not mean that it cannot be influenced, i.e. that it cannot be changed. If bonus payments are linked to such KPIs, it can become very frustrating for employees if they feel that their activities have no influence whatsoever on the achievement of targets.
If, for example, the bonus payment of a UX researcher is linked to the number of usability problems solved, this has only a minimal influence on this KPI, as the greatest effort here lies in the design and development.
Good KPIs are recorded regularly and are subject to fluctuations
Only if KPIs are recorded at regular intervals can they reflect a development over time. In principle, the higher the frequency of the measurement, the better. The more data points there are, the more detailed the analysis can be.
While some KPIs can be recorded daily or even hourly (e.g. number of visitors to the website) and allow important conclusions to be drawn (e.g. advertising should be placed at 4 p.m. because this is when most visitors are on the website), others can only be recorded monthly or less frequently (e.g. month-to-month retention rate).
For KPIs that can only be measured infrequently, they should be recorded at least once a quarter in order to take into account the effects of seasonality. For such KPIs, it is also the case that some measurements must first be available before meaningful conclusions can be drawn.
Imagine that the sales of your own online store increase by 50% in the fourth quarter compared to the third quarter. You enthusiastically ask the product owner what the latest changes were to the website and are proudly told that the search feature has been removed to create more space for advertising. Satisfied and relaxed, you go on a winter vacation with your family, only to receive a huge shock the next year with an immense slump in sales and bewildered emails from UX researchers asking why none of their testers can find anything on the website, but instead click on the advertisement for the competitor’s store. And all because the seasonality of the Christmas business has been forgotten…
Good KPIs must not only be measured regularly, they must also be subject to fluctuations between these measurement points. This is because if a KPI only ever moves in the upper (ceiling effect) or lower (floor effect) range relative to the target, regardless of what business activities have taken place beforehand, it is meaningless and must be adjusted.
Good KPIs correlate with other company measures
By “other company measures” we mean, for example, the company’s turnover, the number of employees in the company, the company’s annual expenditure or similar. All these variables can of course also be UX KPIs themselves, and often they are. However, these are usually in departments other than the UX team, which is why they are referred to here as “other company measures”.
These company figures are often the ultimate performance indicators of the company, showing whether it is on the up or on the verge of bankruptcy. Accordingly, all activities at lower levels, such as the UX team, should also have a positive effect on them. For example, the number of usability problems solved should correlate positively with annual turnover and the number of employees (in the UX and product area). If there is no correlation with annual sales, the usability problems solved may not have mattered. If there is a negative correlation with the number of employees, this may indicate serious process problems and low efficiency in the UX and product team.
Of course, correlations between KPIs at lower complexity levels and the highest company measures are always complex relationships, which is why other factors such as KPIs from other teams must also be taken into account in such calculations.
Good KPIs are individually adapted to the company
Although there are a number of classic KPIs that are relevant for almost every company, the KPIs must be selected individually for each company in order to take the respective circumstances into account.
For a company that generates the majority of its revenue through sales calls, a high abandonment rate on the website is not so bad as long as enough interested parties call. For a company that relies almost exclusively on their online shop, a high abandonment rate on the website can be fatal.
Contact us if we can support you in selecting and defining your UX KPIs.
UX KPIs at all levels – process, impact and outcome KPIs
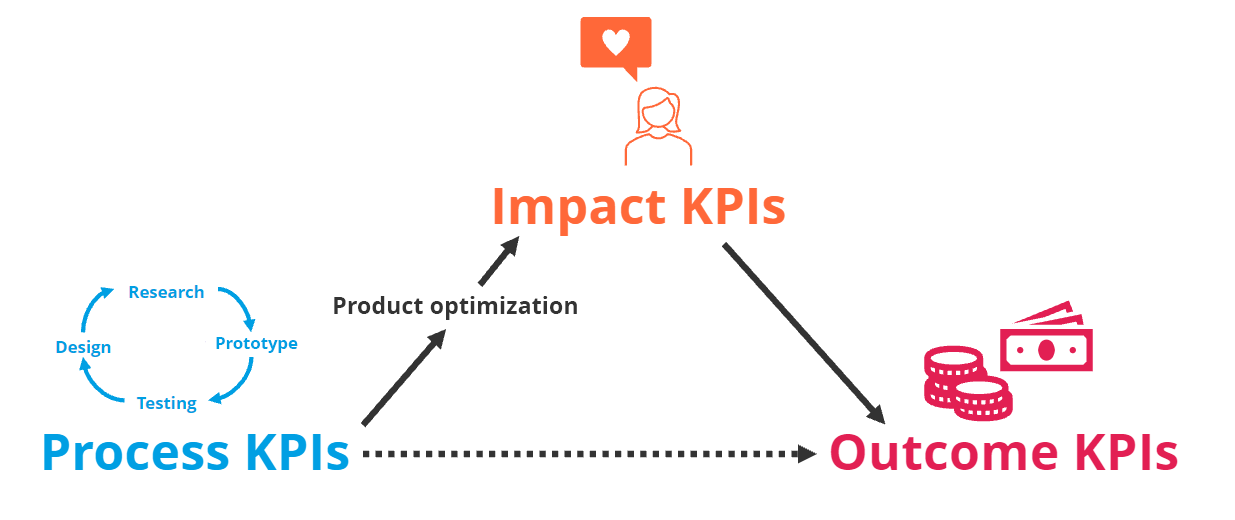
In the area of UX, we differentiate between process, impact and outcome KPIs. These build on each other hierarchically, and we recommend that every company measures at least one UX KPI in each of these areas.
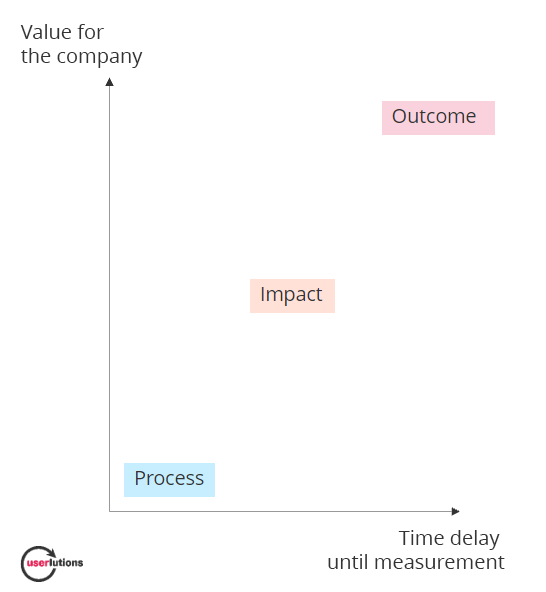
Process KPIs
What are process KPIs?
Process KPIs can be measured very easily and frequently, but have little significance for the company as a whole. These are KPIs that measure the efficiency (and sometimes the effectiveness) of research, testing, design (and development) processes.
Good and bad process KPIs
A simple example of a poor process KPI is the number of usability problems found in a user test. In theory, this KPI measures the effectiveness of a single usability test. In practical terms, however, it is a poor KPI because it can be manipulated very easily. This KPI becomes more useful if the same website is tested repeatedly over time and different people evaluate the tests. This reduces the risk of manipulation and thus poor measurement accuracy (reliability) and a positive or negative development can be read over the various measurement times.
Although the example above illustrates that even poor KPIs can deliver added value through certain adjustments, it usually makes more sense to define KPIs on the dimensions of monetary value (€), time (t), or share (%). It also makes sense to record KPIs that capture a larger process, i.e. not just the identification of a problem in a test, but, for example, the solving of this problem through the collaboration of UX researchers, UX designers and developers.
Good process KPIs would therefore be the average time to solve a usability problem or the average cost to solve a usability problem. These KPIs measure efficiency rather than effectiveness, are less susceptible to manipulation and are more important for the company as a whole, as they measure the efficiency of a process that spans several teams. After the UX researchers have identified the problems in the usability test, UX designers also have to develop concepts and designs and the development team has to implement them.
Examples of process KPIs
- t average time or € costs per identified usability problem
- t average time or € cost per usability problem solved
- % Share of solved usability problems in identified usability problems
- # Number of usability problems in the backlog
- # Number of usability tests in the sprint
- t average time or € costs per usability test in the sprint
- t Duration of a complete iteration (Test > Design> Test)
Impact KPIs
What are impact KPIs?
Impact KPIs can be measured relatively easily and frequently, but not as easily and frequently as process KPIs, as a significant change to your own product must have occurred before each measurement point. The significance of these KPIs for the company as a whole is far greater than that of process KPIs, as they measure the effect that certain corporate activities have on the usability and UX of a company’s own product. Better usability and UX means a better experience for users, which in turn leads to a better business performance.
Good and bad impact KPIs
Since impact KPIs test the usability and UX of a product, it makes sense to simply measure them using the same methods that you already use in your UX research and UX testing processes, for example usability tests. This could tempt you to simply record the number of usability problems found in a user test as a KPI. However, it was already clear from the process KPIs that this is a poor KPI. However, this example also illustrates that the same KPI can be understood as a process KPI or an impact KPI. If you understand it as a performance characteristic of a UX researcher who is supposed to identify as many problems as possible, it is considered a process KPI. If it is understood as a performance characteristic of a website that should contain as few usability problems as possible, it is considered an impact KPI. Regardless of how you understand these KPIs, there are better KPIs for measuring process and impact.
Standardized and, above all, natural quantitative measures are much better suited as impact KPIs than the quantification of qualitative methods (e.g. counting problems in user tests).
Standardized measures refer to validated scales such as the User Experience Questionnaire (UEQ), System Usability Scale (SUS), Single Ease Question (SEQ), Customer Satisfaction (CSAT) or Net Promoter Score (NPS). Here it is important to observe the principle that each KPI must be individually adapted to the company. Depending on the product, sector and question, one of the scales just mentioned may be suitable, or maybe none at all.
Natural quantitative measures are those that are firmly anchored in physics (e.g. the average time it takes a test subject to complete a certain task) or those that are easily quantifiable (e.g. the proportion of test subjects who succeed in completing a task or the proportion of test subjects who make a certain error).
In order to record impact KPIs with sufficient data quality, it is not enough to have five, seven or ten test subjects fill out a questionnaire in a usability test. Rather, simple scales should be integrated directly on the website or quantitative methods such as surveys, click tests or simply website analytics should be used.
Examples of impact KPIs
- Standardized scales and metrics
- User Experience Questionnaire (UEQ)
- System Usability Scale (SUS)
- Single Ease Question (SEQ)
- Customer Satisfaction (CSAT)
- Net Promoter Score (NPS)
- Task-related dimensions
- % Task success rate
- % Error Rate
- t Time on Task
- (Quantification of qualitative statements in usability tests or other methods)
Outcome KPIs
What are outcome KPIs?
Outcome KPIs can be recorded even less frequently than impact KPIs, as there is a time lag between a business activity (e.g. identifying a usability problem and revising the website) and what is measured (e.g. the conversion rate). On the other hand, the outcome KPIs are highly relevant for the company as a whole, as they are directly related to the most important company key figures (e.g. total revenue). While impact KPIs show the importance of business activities for users (e.g. the product is easy and more fun to use), outcome KPIs in turn show the importance that this impact on users has for the company (e.g. more users use the product more regularly and buy more).
Good and bad outcome KPIs
There are hardly any bad outcome KPIs in the sense that they could be manipulated or favor bad decisions. Bad outcome KPIs are KPIs that are irrelevant for the company. While for some companies only the conversion rate counts, and it is important to get users to complete a purchase as directly and quickly as possible (e.g. online shops), for other companies it can be very important that their users spend as much time as possible with their product, for example to place advertisements there (e.g. social networks).
Therefore, each company must define for itself which outcome KPIs are most relevant.
Examples of outcome KPIs
- Behavior on websites
- % Click Rate
- % Conversion rate
- % Bounce rate
- t Average time on site
- # Number of pages visited
- Purchasing behavior
- € Shopping cart sizes
- % Retention rate
- t Retention intervals
- Usage behavior of products
- #/t Frequency of use per time unit
- t Period of use
- (Other company sizes)
- € Turnover
- % growth
- € Costs
Relationships between process, impact and outcome KPIs
I mentioned at the beginning that the three different KPI types build on each other and are interrelated. Whether and to what extent this correlation exists can be evaluated as a separate KPI for the quality of your own KPI system.
Process KPIs show the effectiveness and efficiency of the UX and product team, which in turn should have a direct influence on the impact KPIs, i.e. the effect on users. For example, if the UX and product team has a solid testing and research strategy and solves many usability problems within a short period of time, the effect on usability and UX for users, i.e. on the impact KPIs, should also be big.
Impact KPIs, in turn, influence the (purchasing) behavior of users and thus have a direct influence on the outcome KPIs. If using a social network is fun for users and offers a good UX (e.g. through infinite scrolling), they will spend more time there, which is a relevant outcome KPI for social media companies.
The outcome KPIs should in turn be related to the most important company key figures. For example, if users spend more time on the social network, they consume more advertising and the company increases its revenue.
If these correlations between the different KPI types do not exist, there may be two reasons for this:
Either individual KPIs are poorly chosen. For a fitness studio, for example, new subscriptions (conversion rate) are probably much more important than the time these customers spend on the website or in the fitness studio (usage time). So for a gym, time on site is probably not a relevant outcome KPI and if there is no correlation between the activities of the UX and product team and the time of use, this is not a bad thing.
The other reason for a lack of connection could be that the activities of the UX and product teams are poorly chosen. For example, the team may solve many usability problems in a short time and achieve their process KPIs, but these are so small and irrelevant that they do not achieve any measurable impact or outcome. In this case, the KPIs fulfill exactly their purpose: they indicate that the current business activities are ineffective and need to be reconsidered.
Conclusion: UX KPIs are the only way to make evidence-based decisions.
At the beginning, I described what can happen if you don’t collect UX KPIs – product owners are overwhelmed by UX research with a mountain of problems, have difficulty selecting the optimizations that are most important and after the optimization it is unclear what they have actually achieved.
However, if you record UX KPIs, things look different. The UX researchers can already make an evidence-based preselection of problems and recommendations, which are handed over to POs in compact form. The POs find it much easier to prioritize optimizations and select them for the next sprint. And when the management asks at the end what the whole thing has achieved, there is a clear answer instead of an embarrassed silence.
This is what working in UX and product teams with KPIs looks like (click to enlarge):

(Illustration: Christin Herrmann)
")


Share
Share this article