MVP for modern emissions and fuel management
How we helped TRACKS to design a software that reduces the fuel consumption of truck fleets
The challenge:
A representative MVP within 1.5 months
Successful investment round leads to time pressure in software development
The road transport industry is currently working at full speed on solutions to reduce fuel consumption and the risk of congestion – and thus increase the efficiency and sustainability of the transportation system. Companies as well as politicians, consumers and investors want to achieve CO2 neutrality by 2050. On the current course, however, logistics emissions will double by 2050. At the same time, only 28% of global freight emissions were disclosed in 2019, and less than 1% in road freight transport. The reasons for this: fuel management and the disclosure of emissions are currently still ineffective, time-consuming and imprecise tasks for transport companies.
Artificial intelligence offers great opportunities here. TRACKS has also recognized this and is developing a software that enables the precise and automatic measurement and allocation of CO2 emissions in road freight transport and suggests relevant, efficiency-enhancing measures to reduce these emissions.
Status of development at the start of the project:
A minimum viable product (MVP) of this software should analyze and predict the fuel consumption of truck fleets in order to improve fuel efficiency and reduce costs. TRACKS accesses data that is already collected from every truck, but networks it better so that fuel efficiency can even be analyzed across fleets and manufacturers.
The technical foundation for efficiency analysis and efficiency comparison had already been laid at the start of the project and programmed in the back end, but awareness of the functionalities and the entire front end of the software was still missing. After a successful investment round, TRACKS was under time pressure – the MVP had to go live within 1.5 months. And so they came to us.

Facts about the project
| Customer | TRACKS |
| Product | Software for predicting the fuel consumption of trucks |
| Duration | approx. 1.5 month |
| Method | UX / UI Design |
| Result | MVP of the software |


The process: From paper prototypes to wireframes to an attractively designed software
Fuel Efficiency Index, sample figures and comparison charts – the challenge of visualizing data
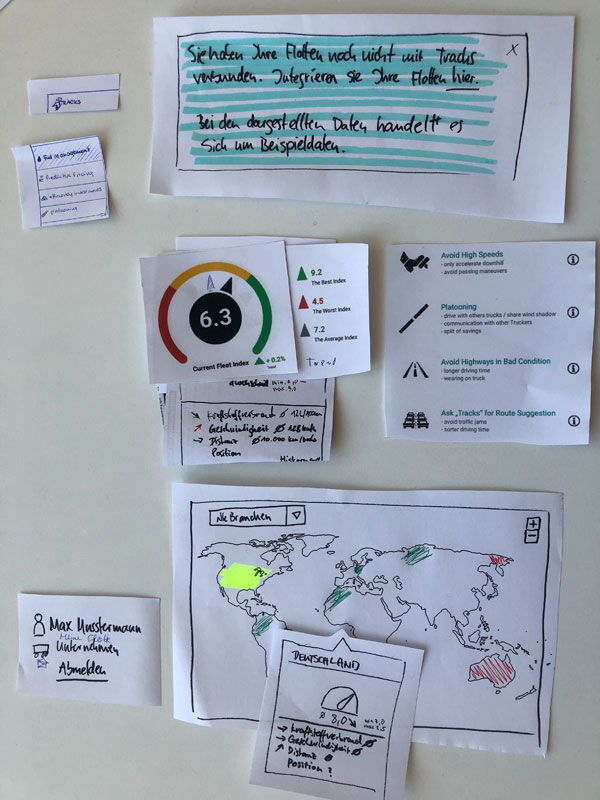
When designing the MVP, we started at the very beginning: together with TRACKS, we defined requirements and features. This was followed by a scribble session in which the first paper prototypes were created.
We built rough wireframes from the paper prototypes. On the one hand, these illustrated where the journey should go and enabled further iterations. On the other hand, TRACKS has already been able to use these low-fidelity prototypes for communication with investors.
In an extensive workshop, we used the wireframes to validate the software’s concept, compile further requirements and refine the wireframes.
In the end, we transferred the visual design of the existing website to the tool and adapted the existing style guide, which had previously focused primarily on print, to the requirements of the software.
The MVP was completed on time.
These are some of the features:
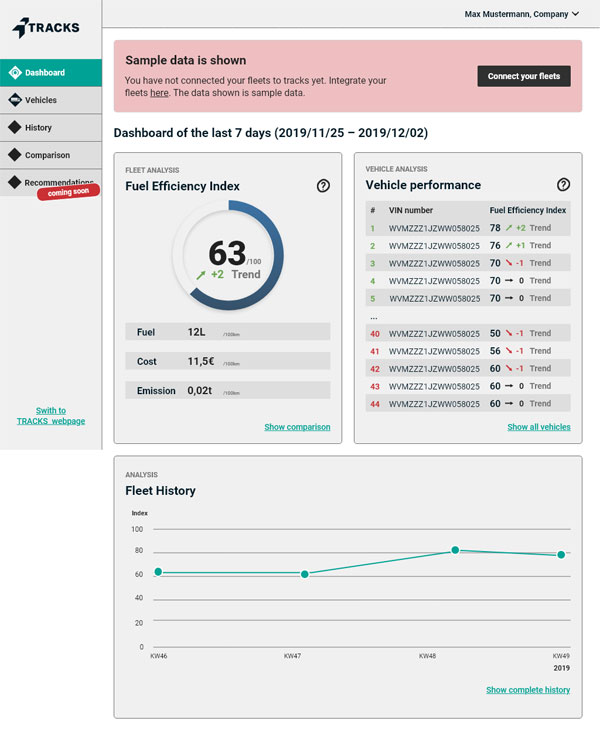
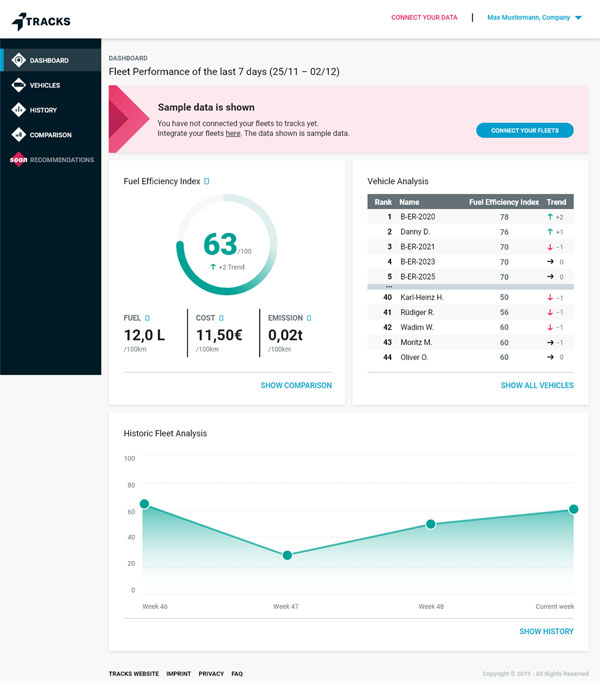
- Fuel Efficiency Index: The fleet manager can view the efficiency of his entire fleet in his dashboard and analyze which vehicles are performing best and worst.
- Demo account: The user account is initially filled with fictitious data to provide an insight into the features and the application without the user’s own fleet being linked to the tool.
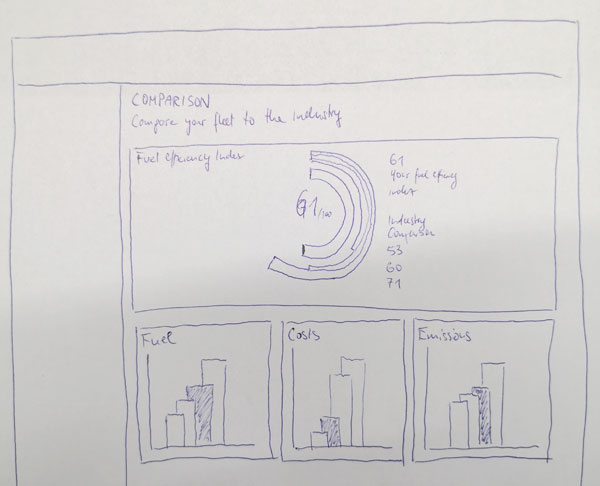
- Gamification: The tool allows you to compare your own fleet with other fleets from the same and other sectors or regions. We developed the necessary interactions, diagrams and filters in an iterative process.
All these features require a clear visualization of the data. Finding the right diagrams was a challenge that we tackled together with TRACKS in several iterations.
The first scribbles and paper prototypes

The result: A representative MVP with an appealing visual design
Just in time for the deadline, we were able to hand over a finished MVP with an appealing visual design to TRACKS.
The application was implemented quickly and was tested and optimized on 3 truck fleets shortly after the end of the project.
Wireframe and visual design in comparison (Pull me!)

What the client says: “Intuitive MVP that doesn’t look like an MVP”
“As an early-stage startup without internal UX expertise, we were faced with the challenge of launching an MVP of our software within 1.5 months. Due to the convincing design portfolio, we sought support from Userlutions to conceptualize and design the first product for and with us.
Our contact person advised us with great expertise, responsiveness and flexibility. Thanks to the lean and pragmatic process, they delivered quick results that we were able to iterate on in close cooperation.
The result is an intuitive MVP design that doesn’t look like an MVP.”


Jakob Muus, Founder & CEO, TRACKS GmbH
Curious?
Within a very short period of time, we conceptualized and designed an impressive minimum viable product for TRACKS that allows them to continue looking for investors, add new features and reach potential customers. Can we also support you with prototype design and UI design? Contact us to receive a non-binding offer:
Are you interested in working with us or do you have any questions?
We offer free and non-binding consultations

Birgit Bärnreuther
Head of Consulting
030 / 544 870 24
(Mo to Fr, 9am to 6pm)
We recommend using your work email – this keeps work and private life separate.
