

MVP for modern emissions and fuel management
UX services

UX design

Prototyping

Interaction design

Gamification

We faced the challenge of launching an MVP of our software within 1.5 months. Userlutions supported us with a high level of expertise, responsiveness, and flexibility. Thanks to their lean and pragmatic process, they delivered rapid interim results that we were able to iterate on through close collaboration.
The result is an intuitive MVP design that doesn’t even feel like an MVP.
Customer
Jakob Muus
Founder & CEO
TRACKS GmbH
A representative MVP within 1.5 months
Successful investment round leads to time pressure in software development
The road transport industry is currently working at full speed to develop solutions that reduce fuel consumption and the risk of traffic congestion—and thereby increase the efficiency and sustainability of the transportation sector. Companies, policymakers, consumers, and investors alike aim to achieve carbon neutrality by 2050. However, on the current trajectory, logistics emissions will double by 2050. At the same time, only 28% of global freight emissions were disclosed in 2019, and in road freight transport, the figure was less than 1%. The reasons for this: Fuel management and emissions reporting are currently still ineffective, time-consuming, and inaccurate tasks for transportation companies.
Artificial intelligence offers great opportunities in this area. TRACKS has recognized this and is developing software that enables the precise and automatic measurement and categorization of CO₂ emissions from road freight transport and suggests relevant, efficiency-enhancing measures to reduce these emissions.
Status of development at the start of the project:
A Minimum Viable Product (MVP) of this software should analyze and predict the fuel consumption of truck fleets in order to improve fuel efficiency and reduce costs. TRACKS accesses data that is already collected from each truck but better integrates this data so that fuel efficiency can be analyzed across fleets and manufacturers.
The technical foundation for efficiency analysis and efficiency comparison had already been laid at the start of the project and programmed in the back end, but awareness of the functionalities and the entire front end of the software was still missing. After a successful investment round, TRACKS was under time pressure – the MVP had to go live within 1.5 months.

From paper prototypes to wireframes to attractively designed software
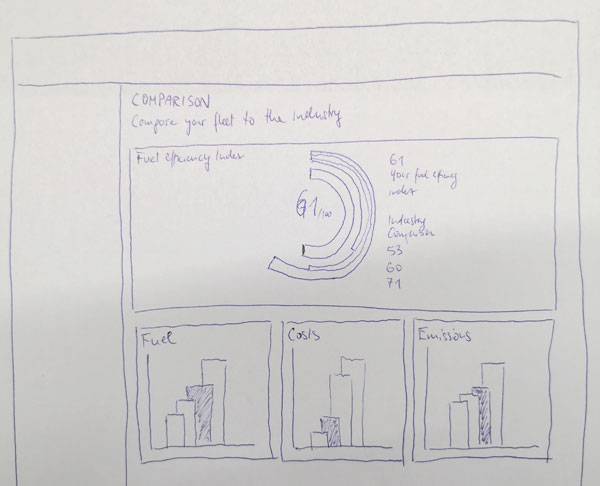
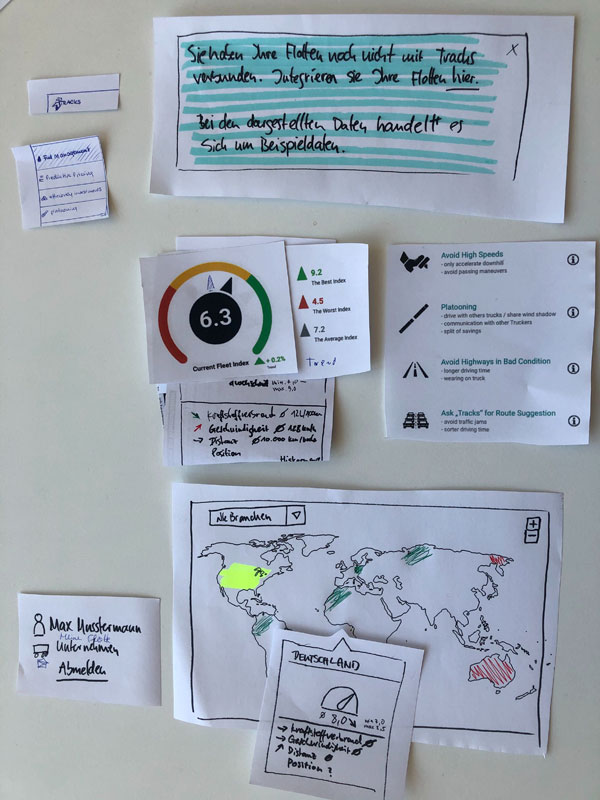
Fuel Efficiency Index, sample figures and comparison charts – the challenge of visualizing data
When designing the MVP, we started from the very beginning: Together with TRACKS , we defined the requirements and features. Building on that , we held a scribble session during which we created our first paper prototypes.
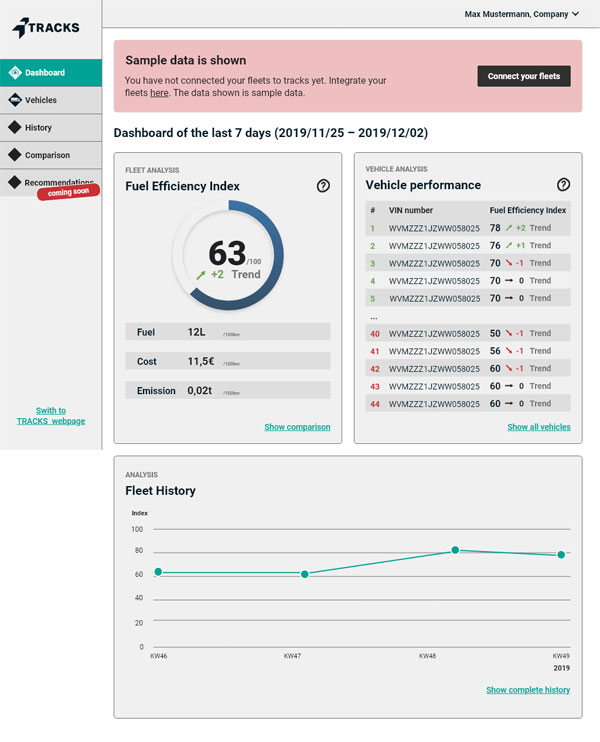
We used the paper prototypes to build rough wireframes. On the one hand, these illustrated the direction we wanted to take and enabled further iterations. On the other hand, TRACKS was already able to use these low-fidelity prototypes to communicate with investors.
In an extensive workshop, we used the wireframes to validate the software’s concept, compile further requirements and refine the wireframes.
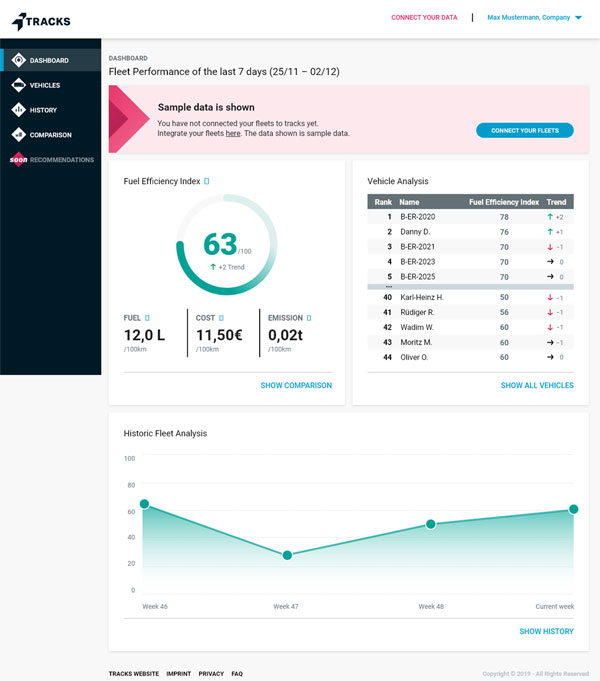
Finally, we applied the visual design of the existing website to the tool and adapted the existing style guide—which had previously been geared primarily toward print—to meet the requirements of software.
The MVP was completed on time.
These are some of the features:
- Fuel Efficiency Index: The fleet manager can view the efficiency of his entire fleet in his dashboard and analyze which vehicles are performing best and worst.
- Demo account: The user account is initially filled with fictitious data to provide an insight into the features and the application without the user’s own fleet being linked to the tool.
- Gamification: The tool allows you to compare your own fleet with other fleets from the same and other sectors or regions. We developed the necessary interactions, diagrams and filters in an iterative process.
All these features require a clear visualization of the data. Finding the right diagrams was a challenge that we tackled together with TRACKS in several iterations.
A high-end MVP with an appealing visual design
Just in time for the deadline, we were able to hand over a finished MVP with an appealing visual design to TRACKS. The application was implemented quickly and was tested and optimized on 3 truck fleets shortly after the end of the project.
Our services
Curious? Here’s how we can help you

User research
We lay the groundwork for your product decisions. Real user feedback to answer your questions—even before you make a decision.


UX testing
Don’t rely on gut feelings: Through UX testing, we identify usability issues with your products and opportunities for a better user experience.

UX design
We develop digital products that delight your users while keeping your business goals in mind.
Where do you want to start? Let’s talk—no strings attached.

Birgit Bärnreuther
Head of Consulting
+49 30 / 544 870 24
(Mon–Fri, 9 a.m.–6 p.m.)
Birgit Bärnreuther, Head of Consulting
+49 30 / 544 870 24
(Mon–Fri, 9 a.m.–6 p.m.)